
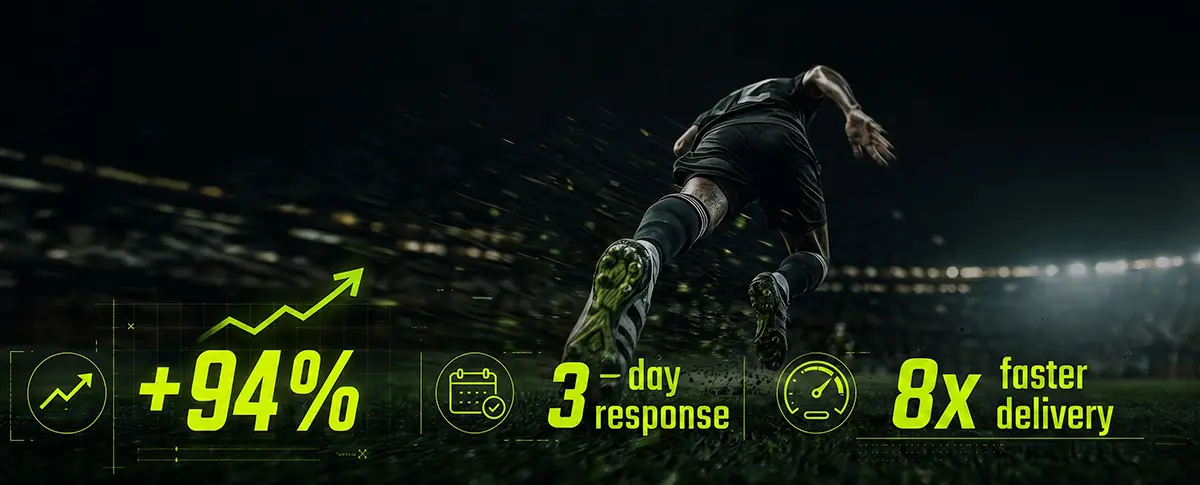

Year over year we have seen a 94% increase in feature requests from customers.
In Q1 2025, customers sent us 60 feature requests. In Q1 2026, they sent 161. That’s a 168% increase in the same quarter, one year apart.

Zoom out to full years, and the trend holds. Requests grew from 227 in 2024 to 441 in 2025, nearly doubling. In 2026 so far we’ve already logged 241, and we’re not yet halfway through the year.
More requests can be a warning sign. It means longer queues, slower replies, and a backlog that quietly grows. However, we found the exact opposite to be true.
When a customer submits a request, the first thing that matters is whether anyone is listening. So we measured time to first response: how long does it take until a real person on our team reply.
In Q1 2025, that took a median of 16.5 days. In Q1 2026, it took 3 days. An 82% reduction, even as request volume nearly tripled.

Approvals moved in the same direction. Time from submission to approval dropped from 5.6 days to 2.9 days, a 48% improvement.
A fast reply is worth little if the feature never ships. So we measured the number that’s hardest to fake: time from request to delivery.
At the start of 2025, it took us an average of 178 days to deliver on these requests. By Q1 2026, it was under 20.
Read that again. The wait between requesting a feature and its use in production fell from roughly six months to under three weeks.
And what we shipped to production speaks for itself:
And the small stuff too. Even something as simple as opening a link in a new tab was a customer request, because the details are what make a trading floor feel built for you.
Some requests are a single market. Others reshape the roadmap. One of the most in-demand capabilities operators were chasing was a bet builder. So we built our own same game parlay engine, Combo Builder, with our odds, our pricing, and full control for you to run your business.
That is what listening at scale looks like. When enough of you ask for the same thing, it stops being a feature request and becomes a priority.
Every number above started as someone like you typing a request into a box.
The roadmap that came out of it wasn’t written in a boardroom. It was written by the people who use LSports every day.
So if there’s coverage you need, a market you’re missing, or a capability that would make your operation sharper, tell us. We read every request, respond within days, and, increasingly, ship.



"É a velocidade e a rapidez com que a LSports pode reunir conjuntos de dados para que possamos usá-los para fornecer o insight e a análise pelos quais somos reconhecidos."

"A LSports está fornecendo mercados que nenhum outro provedor pode oferecer, e com a ajuda da LSports, temos uma oferta rápida de apostas em jogadores em eventos e ligas importantes."

"A LSports é a coletora de dados mais rápida do setor. Eles são excelentes em obter dados de diferentes fontes e entregá-los em tempo real."

"Depois de usar o BOOST, posso dizer honestamente que esta é uma das melhores e mais avançadas ferramentas de engajamento com IA que implementei em nossa plataforma."



