2026年4月23日
体育数据可视化:基于数据的决策指南
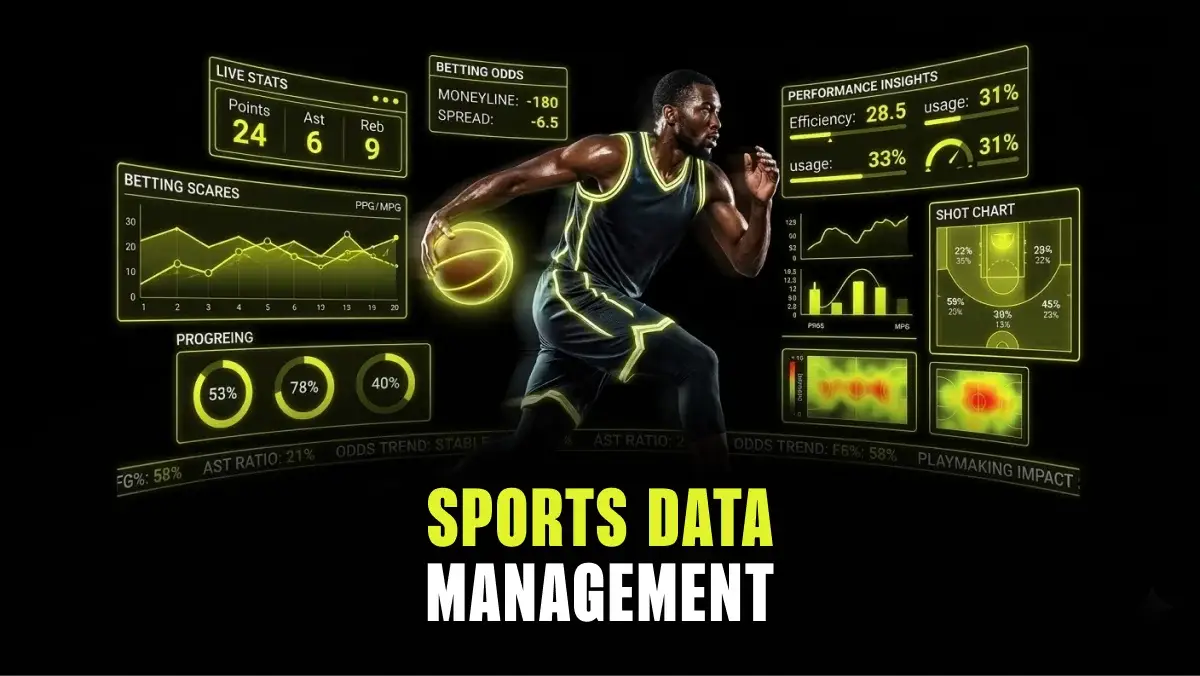
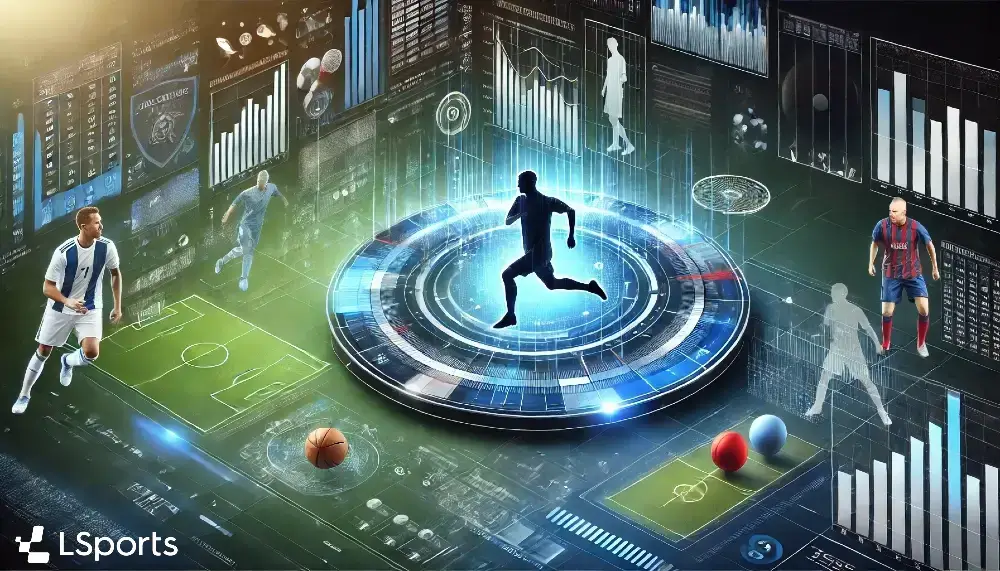
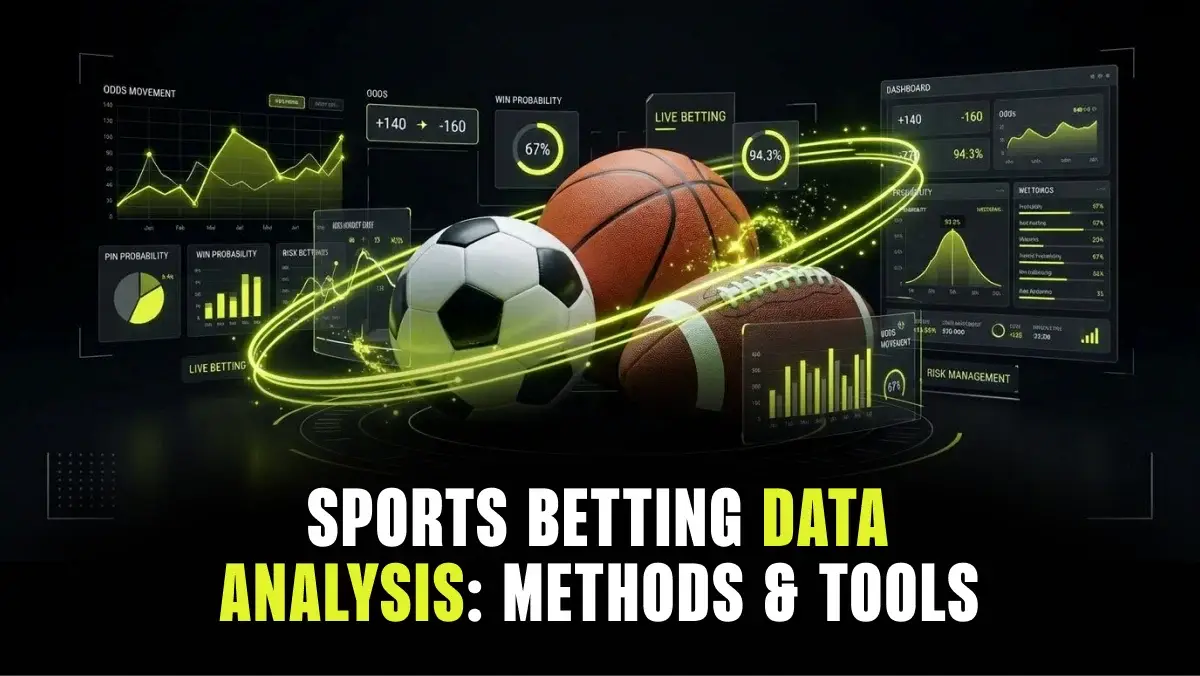
现代体育产生数据的速度令人瞠目。例如,仅LSports一家公司就从130多个来源收集信息,每年产生数十亿个数据点。数据量还在加速增长:根据《LSports 2025年度数据报告》,体育数据总消耗量同比增长了16%。最大的挑战在于如何解读所有这些数据,并且要实时完成。这就是数据可视化的用武之地。 这一过程将原始数据(如比分和赔率水平)转化为图表、热力图和仪表盘等可视化形式。可视化既能为教练、球队和投注者带来益处,但对博彩公司而言,其作用尤为关键。在此情境下,可视化作为支持系统,有助于实现快速、准确的决策,防范亏损,并推动业务成功。本指南将探讨体育数据可视化、其运作原理,以及博彩公司如何有效利用它。

在本文中
订阅
保持领先地位
获取有关体育数据、博彩趋势和行业新闻的最新见解——直接发送到您的收件箱。
这是一个标题
要点总结
- Sports data visualization is operational intelligence.
It translates complex, high-velocity sports data into formats that enable faster and more accurate decisions on the trading floor.
- Visualization gives sportsbooks a direct edge.
Internal dashboards help traders monitor numerous matches simultaneously, manage liability, spot sharp action, and flag where attention is needed.
- Different visualization types serve different functions.
Many types of visualization exist, including liability heatmaps, sentiment-vs-odds overlays, and fraud detection scatter plots. Each addresses a distinct operational need.
- Speed and simplicity define effective design.
Visualizations need to pass the three-second test, allowing traders to identify a danger zone in three seconds or less.
- AI is shaping the next generation of visualization tools.
Technologies like predictive overlays that project liability in real time and contextual betting visuals that adapt to individual betslip contents are already emerging.
Visualization makes understanding easy
Using data visualization methods, operators can better understand the market and trends, which in turn helps with:
- Risk mitigation: Visual tools make it possible to identify sharp bettors and unusual betting clusters before they become a serious liability. An eye-catching alert on a heatmap enables faster processing than scanning rows in a spreadsheet.
- Trading efficiency: A well-designed dashboard allows a single trader to oversee 50 or more live matches at once. The visualization layer handles the filtering, flagging only the markets that require human attention. Without it, traders drown in data they can’t process quickly enough.
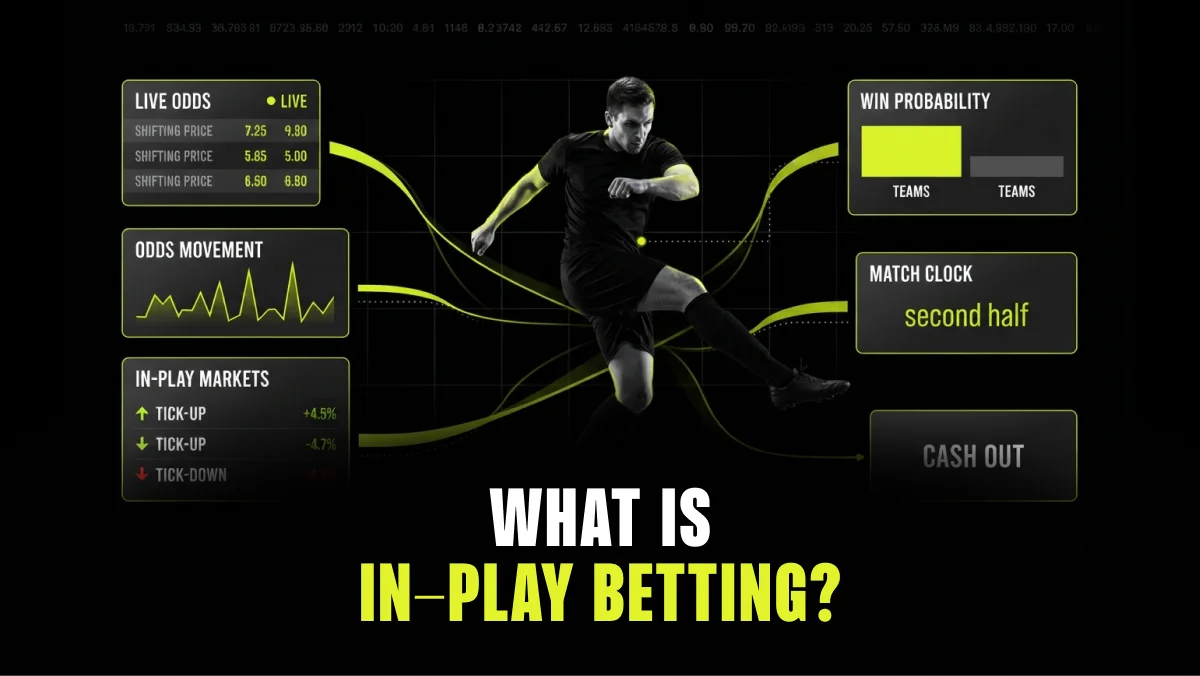
- Betting velocity increase: Visual elements like momentum bars and live match animations encourage micro-bets and keep users engaged longer. The average number of bets per session tends to rise when bettors can see momentum shifting in real time rather than reading static scoreboards. That increased engagement feeds directly back into operator revenue through higher session times and more frequent wagering.
Sports data visualization examples
Discover common use cases for sports data visualization in sportsbook operations:
Risk and liability visualization
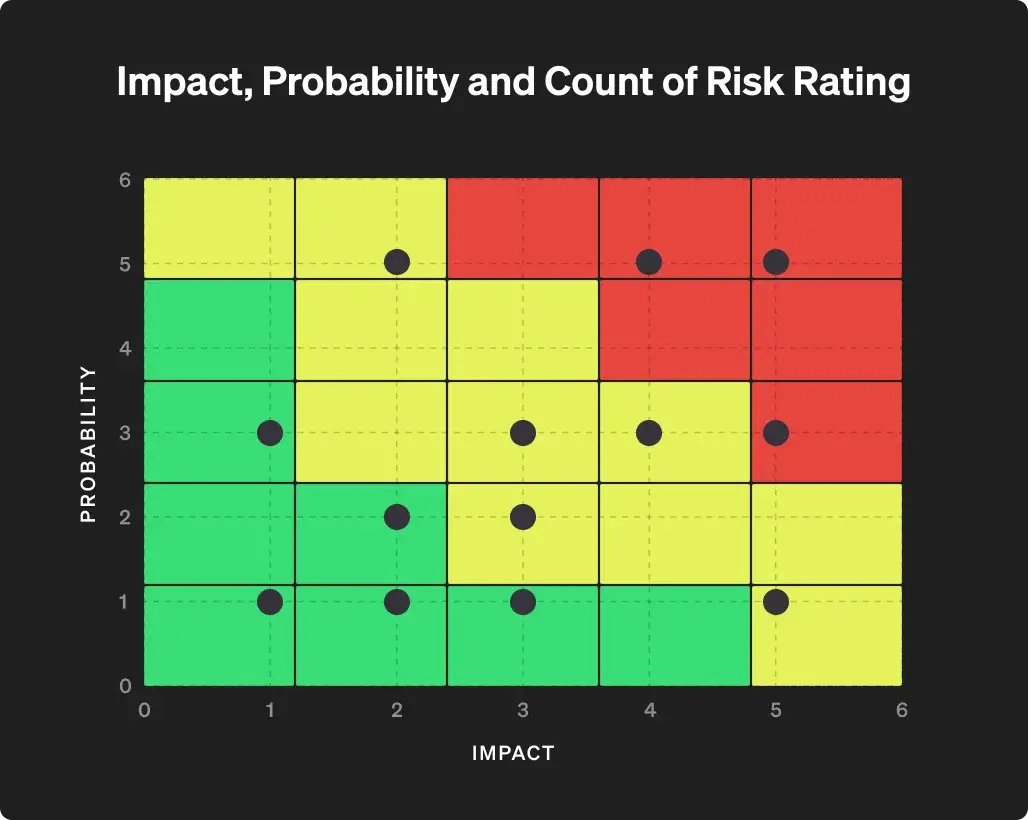
Visuals like liability heatmaps help bookmakers evaluate where they’re overexposed. A practical approach is to plot market volatility against current liability on a matrix. This gives traders a two-dimensional view of where risk is building fastest.
The key distinction here is moving beyond simple volume data, such as heavy money landing on a favorite. Traders need a visual alert, such as a pulsing node, that indicates the payout-to-reserve ratio has crossed a predefined safety threshold and signals that action is needed.
Market sentiment vs. odds movement
Operators live and die by the line. One of the most valuable visualization types overlays public money percentage with actual odds movement on a shared axis. This reveals steam moves, where sudden heavy betting hits across multiple books, and reverse line movement, where odds shift opposite to public money flow.
Seeing these patterns graphically helps trading desks immediately distinguish sharp action from square money. That distinction determines whether to adjust the price, hold the line, or widen exposure limits on a given market.
Behavioral and fraud detection
Data visualization also powers the first line of defense against arbitrage bettors and syndicates. Scatter plots of betting frequency against stake size highlight abnormal patterns at scale. Link analysis graphs expose connections between seemingly unrelated accounts through shared IP addresses, device fingerprints, or similar betting sequences.
High-speed visualization of clustered betting behavior lets risk teams act before bonus abuse or coordinated fraud causes material damage.
Conversion-focused bettor visuals
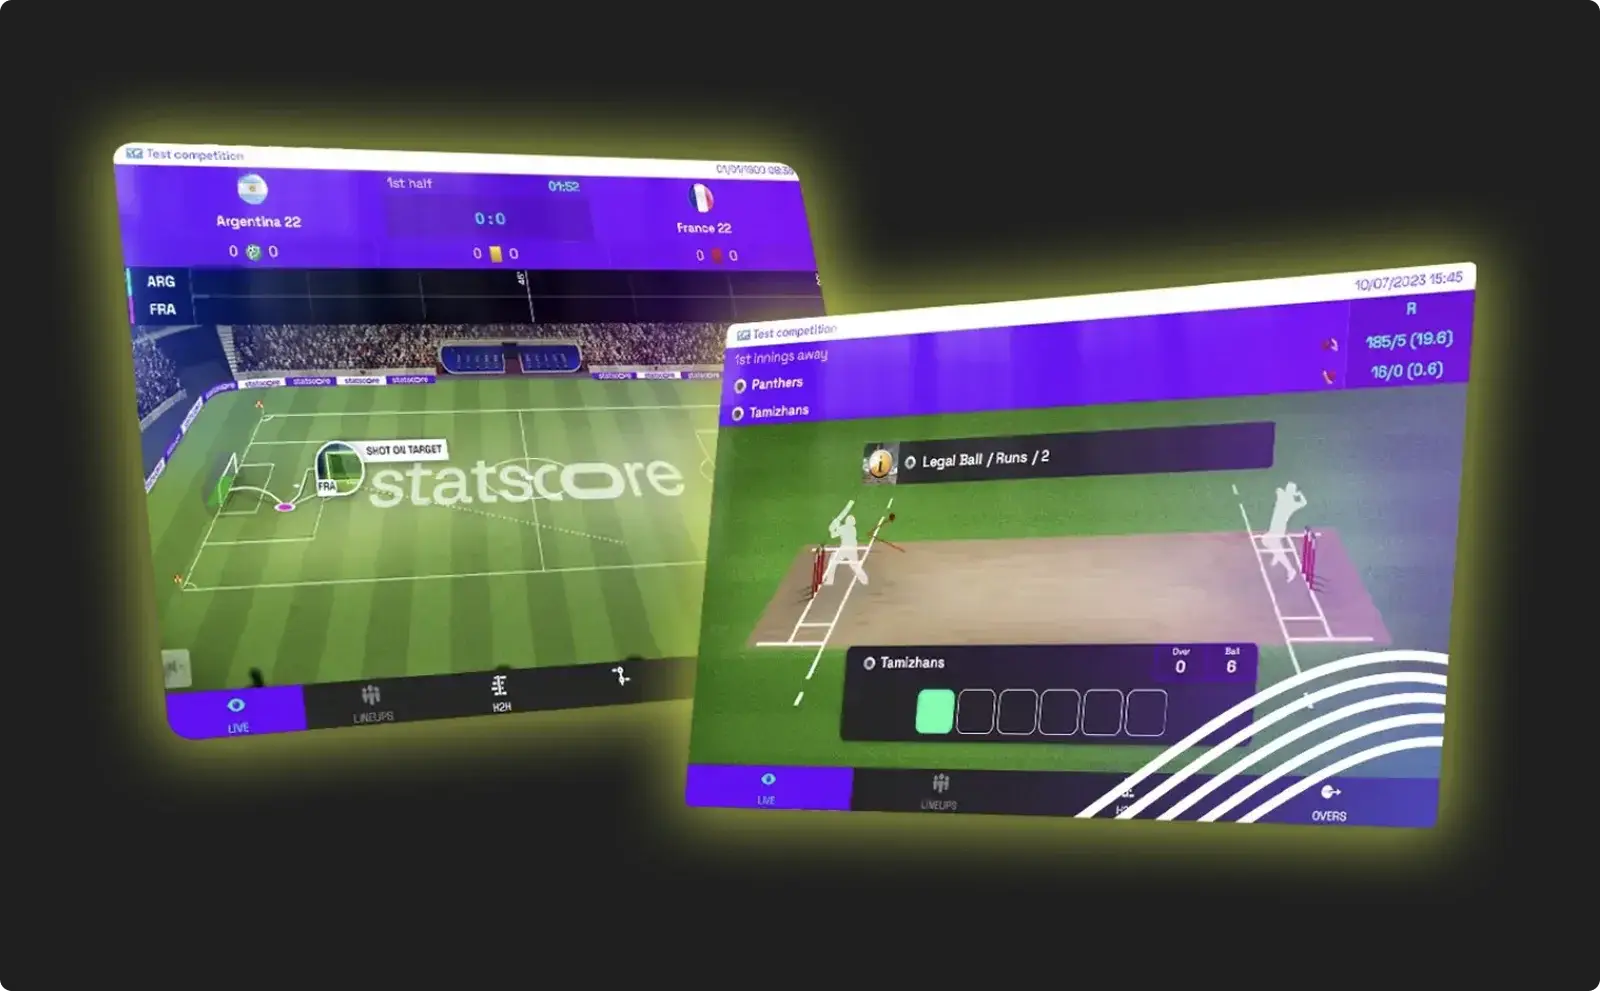
Visualization can also help gamify the betting experience and reduce the time to bet. Live match trackers and bet-integrated widgets act as a bridge between watching the action and placing a wager.
Consider a football match tracker that highlights a “danger zone” when the ball enters the final third. That visual trigger can prompt a contextual next-goal bet offer, creating a frictionless path from observation to wager and shortening the decision cycle.
This translates directly into higher handle per session and stronger in-play margins, particularly with fast-moving sports where betting windows are narrow.
How sports data turns into visuals
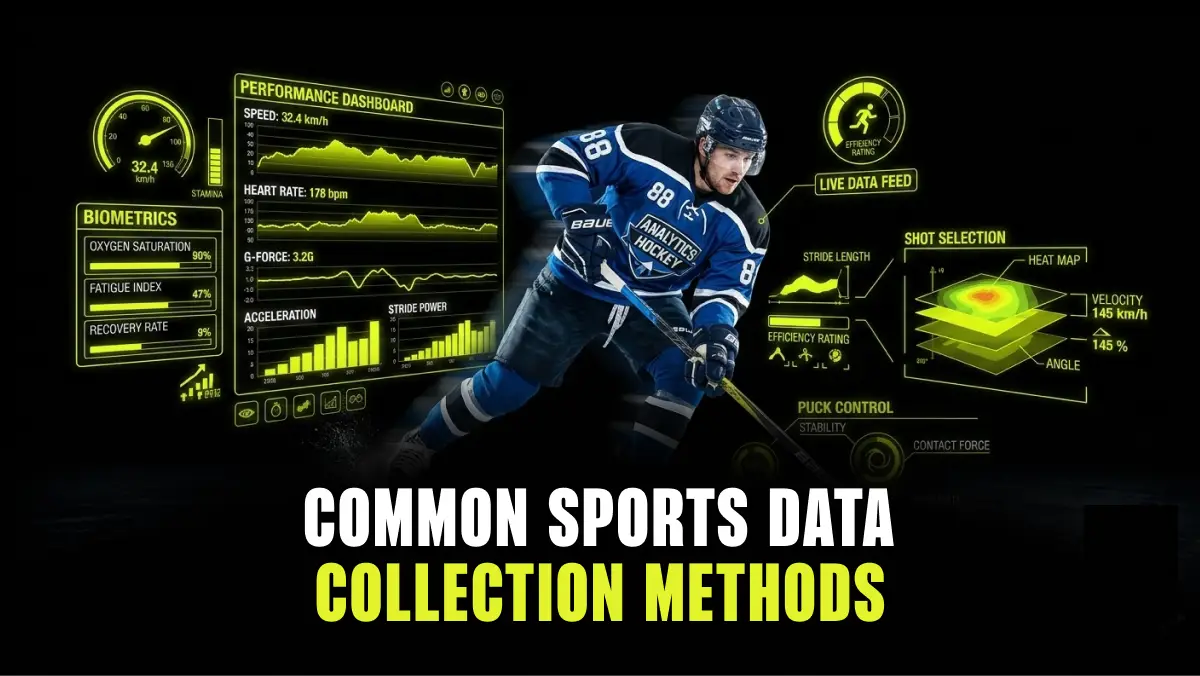
The pipeline typically starts with data collection at the event. Next, the data flows into the application programming interface (API) and then onto the dashboard or widget. The entire chain needs to operate with <100ms latency for in-play trading to remain competitive. Any gap in that chain creates exploitable windows for bettors.
Data normalization is a less obvious but equally important step. When a sportsbook pulls data from multiple providers, the same team or competition may carry different identifiers across feeds. Mapping and syncing these identifiers ensures that “Team A” in the visualization matches “Team A” in the odds engine. Without this alignment, dashboards might display inaccurate or conflicting information.
On the delivery side, modern visualization tools use push-based data feeds and WebSocket connections to update in real time without requiring a page refresh.
Many data providers, including LSports, now offer built-in visualization components, including live match trackers, win-probability graphs, and heatmaps, that operators can embed directly. For internal analytics, trading and operations teams often supplement these with platforms like Power BI, Tableau, or proprietary dashboards tailored to their specific workflows.
Sports data visualization best practices
The most effective trading visualizations follow these principles:
- The three-second rule: If a trader cannot identify a trend within three seconds, the design has failed. Following this principle is essential for detecting danger zones, such as markets that need suspension, liability spikes, or irregular activity.
- Visual hierarchy: Suspension states and large-stake alerts should dominate the display, while historical stats and secondary metrics belong in lower-priority positions. The trader’s eye needs to go to the most urgent information first.
- Color coding: Graphs often use red for suspended markets, yellow for drifting or at-risk positions, and green for stable markets. This convention lets traders scan across dozens of open markets without reading individual data points.
- Clean interface: More data on a screen does not mean more value. Every element should either affect the price or affect the risk assessment. If it does neither, it’s adding cognitive load without a corresponding benefit.
- The basics: Clean data is the foundation of effective visualization. To achieve it, it’s important to verify data, format it correctly, remove duplicates, complete missing values, and conduct regular audits.
The present and future of visualization in sports
Artificial intelligence and machine learning are already standard in visualization systems. Pattern recognition algorithms identify relevant metrics and surface them automatically. They learn from historical betting data to highlight anomalies that a human analyst might miss or take hours to detect.
The next frontier is predictive overlays. Instead of showing current liability, these tools project where the liability is heading as the game progresses. A model that anticipates a surge in next-goal betting when possession stats shift can give the trading desk a meaningful head start on adjusting exposure.
Contextual betting visualization is another development gaining traction. This technology adapts what the bettor sees based on the contents of their betslip, surfacing correlated markets and live statistical trends tied to existing selections.
LSports: Powerful data for powerful decisions
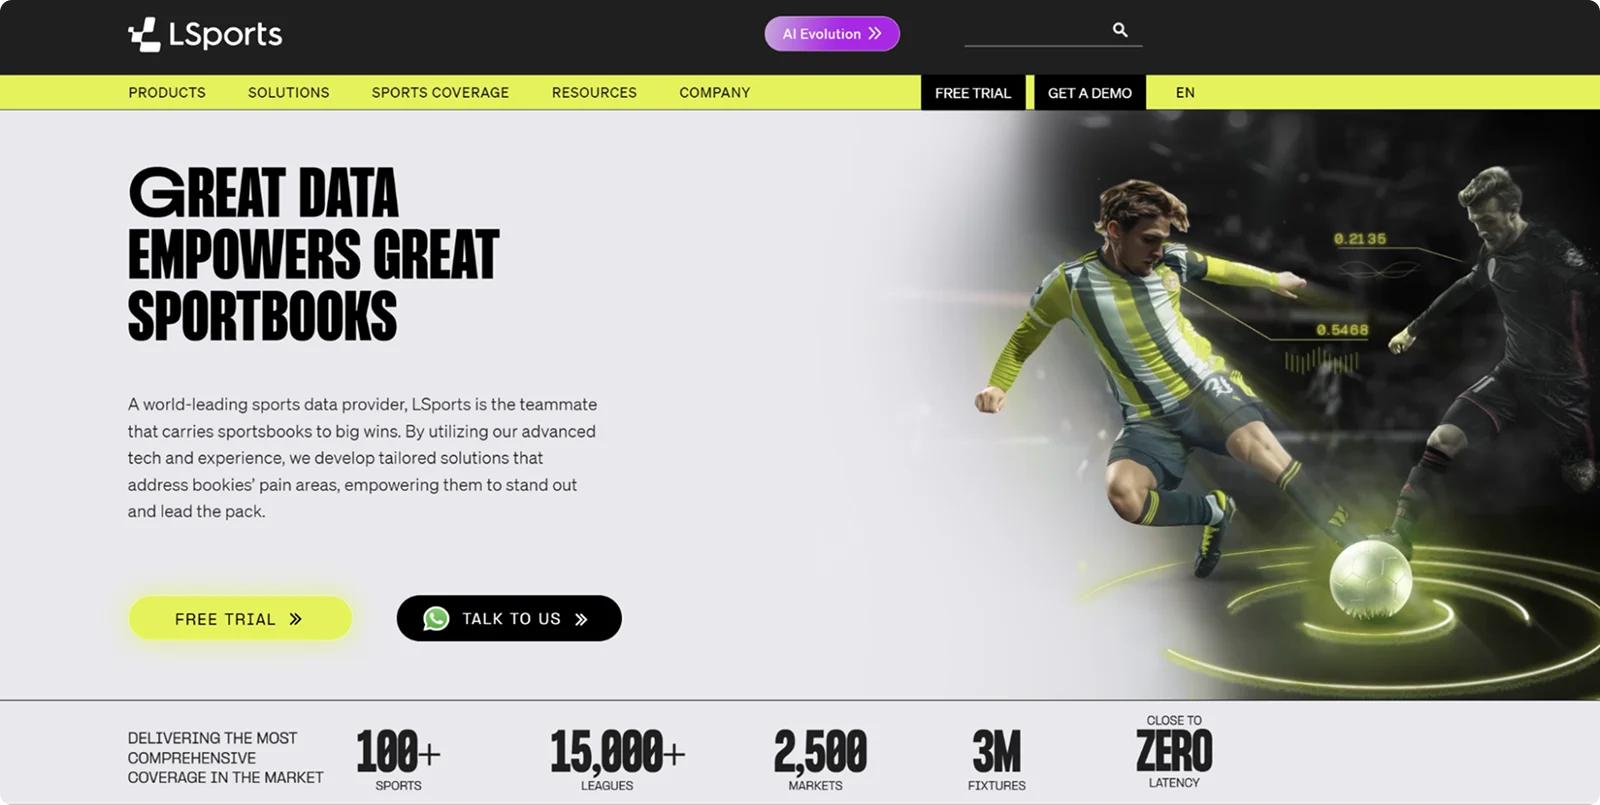
LSports is a global sports data provider offering ARENA360, an integrated platform combining trading, risk management, performance analytics, and engagement tools. To aid in your decision-making, LSports offers:
- Fast, accurate data: Data flows from over 130 live sources across 100+ sports, 15,000+ leagues, and 2,500 markets with close-to-zero latency.
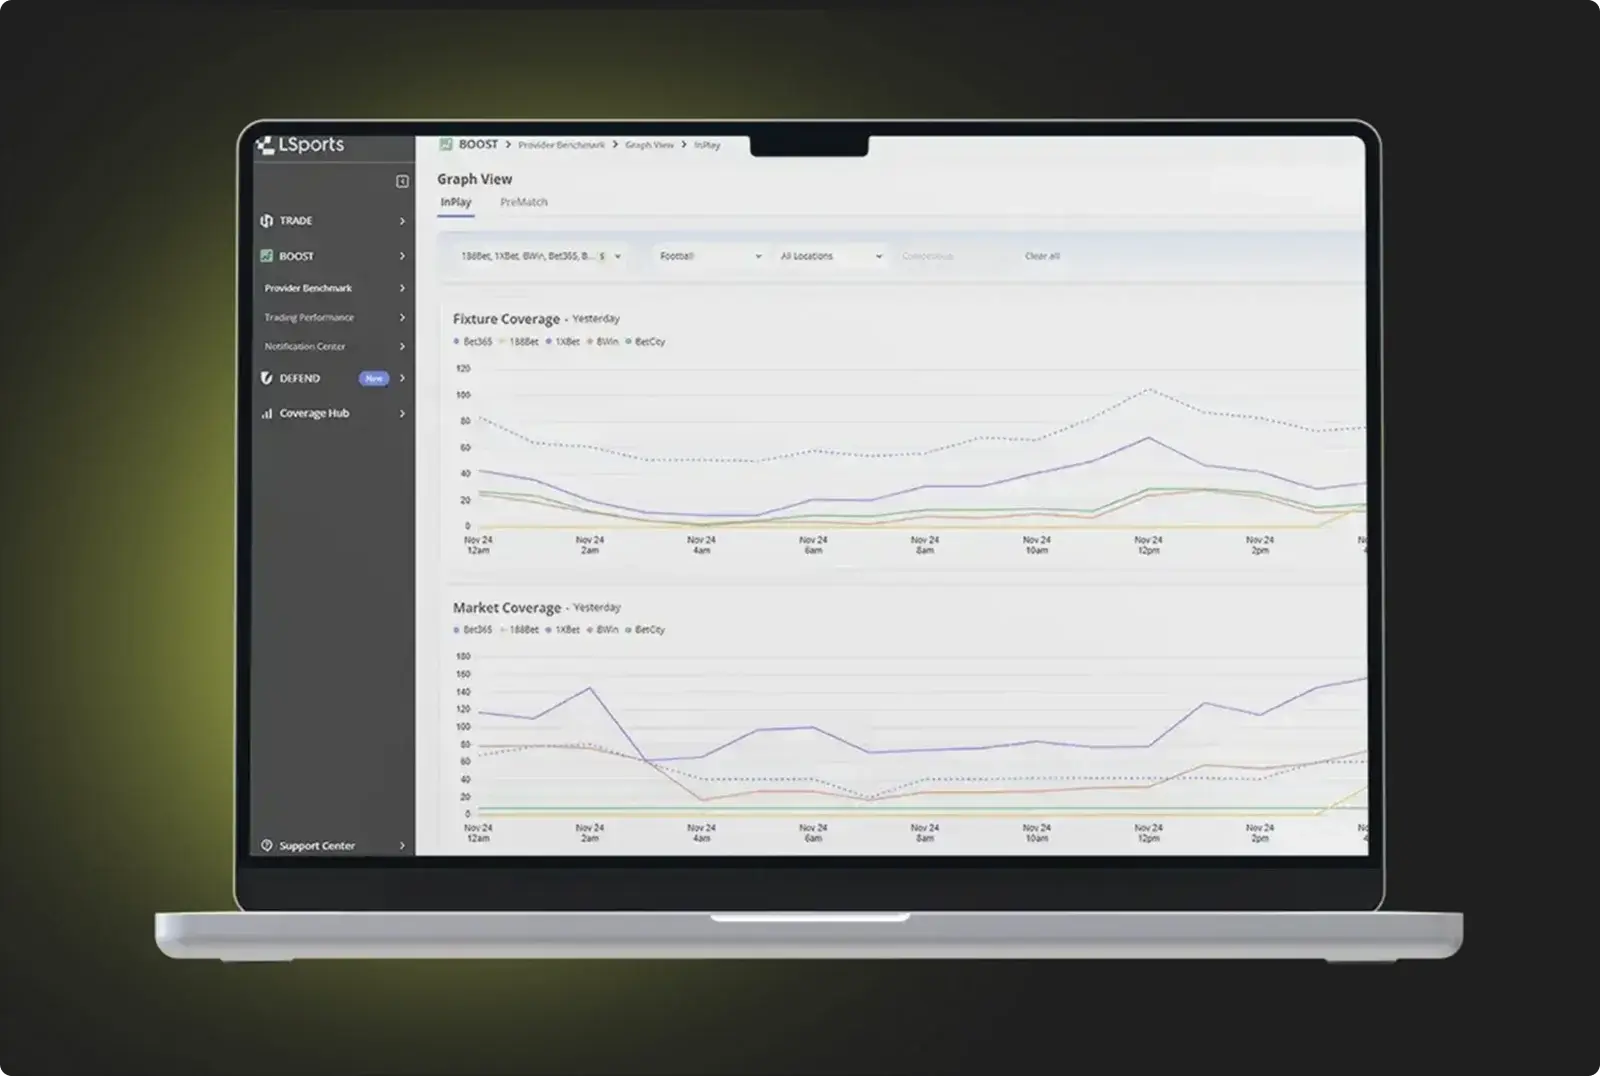
- BOOST: This product gives trading teams visual access to market uptime, margin behavior, and provider efficiency through interactive trend analysis and comparison graphs. Instead of reviewing static reports, operators benchmark their primary provider against competitors for fixture and market coverage in real time.
- DEFEND: With LSports, operators also get liability tracking, player profiling, and fraud detection through dashboards that combine automation with manual override capability.
- Live Match Pro: LSports provides animated play-by-play visualizations across 18 sports and 4,000+ competitions. These embeddable widgets give bettors a reason to stay on-platform and engage with in-play markets.
ARENA360 delivers the visualization, speed, and analytical depth to turn growing data volume into an operational advantage. Sign up for a free trial or request a demo to see the platform in action.
Frequently asked questions
What is sports data visualization?
Sports data visualization is the process of converting raw sports data like scores and odds into visuals like charts, heatmaps, and dashboards. Sportsbook operators use visualization to transform high-volume data streams into actionable intelligence that supports faster trading decisions and better risk management.
How does data visualization benefit sportsbooks?
Main advantages of visualization include:
- Improved risk mitigation by making liability exposure immediately visible
- Increased trading efficiency by letting traders monitor many markets simultaneously through visual flags
- Higher player engagement through interactive features like live match trackers that encourage more frequent betting
What are common sports data visualization tools?
Sportsbooks typically use a combination of provider-built tools, such as live match trackers and real-time odds dashboards, and standard analytics platforms like Power BI. Many data providers, including LSports, offer embeddable visualization widgets as part of their product suite, covering both internal performance analytics and bettor-facing match animations.