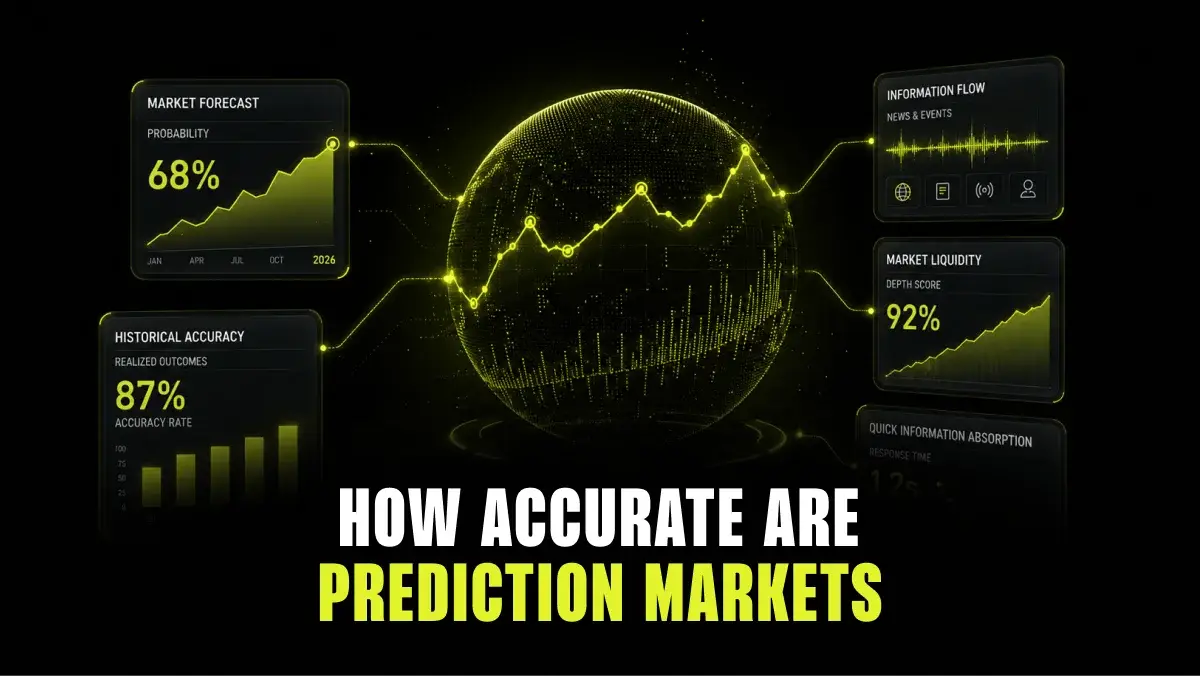

Research shows that prediction markets often outperform polls and expert forecasts because they combine information from many participants. However, their accuracy depends on factors such as liquidity, contract design, and the speed at which new information is reflected in market prices.
Accuracy can vary between platforms and even between individual markets. Comparing multiple sources instead of relying on a single prediction market gives you a more reliable read of where the market stands and reduces the impact of any one market’s pricing inefficiencies.
Comparing multiple markets, standardizing contract rules, updating prices in real time, and regularly measuring forecasting performance all help ensure a more accurate and trustworthy prediction market offering.
LSports provides a single, standardized feed with real-time prices, contract details, settlement data, and broad market coverage. This makes it easier to deliver accurate, continuously updated prediction markets while keeping integration and operational complexity low.
Prediction markets are platforms where people buy and sell contracts based on the outcome of future events, such as elections, sports championships, or economic trends. Each contract’s price reflects what the market believes is the likelihood of that event happening.

For example, a contract trading at $0.65 implies that the market prices the event at a 65% chance of occurring. As people trade and new information becomes available, contract prices rise or fall to reflect changing expectations.
In many cases, prediction markets outperform polls, expert opinions, and even some statistical models because they combine the knowledge and expectations of many participants.
Prediction markets can be highly effective at forecasting election outcomes. One of the best-known examples is the Iowa Electronic Markets. Its forecasts outperformed traditional opinion polls 74% of the time across several US presidential elections, according to a 2026 working paper from the University of Iowa.
Iowa Electronic Markets remained well-calibrated throughout the 100 days leading up to elections and showed little evidence of common forecasting biases.
When the researchers compared these results with similar election markets on Kalshi, they found a much stronger favorite-longshot bias on the commercial platform. This contrast shows how design choices like fees, position limits, and trader incentives can move forecasting accuracy.
The 2024 US presidential election is often cited as an example of prediction markets outperforming traditional polling. While many polls suggested the race remained extremely close, major prediction markets had already identified Donald Trump as the favorite weeks before Election Day.
One 2025 study found that Polymarket predicted both the national result and several key swing states more accurately than polling data. According to the researchers, Polymarket had established Trump as the clear favorite by mid-October, while many polling models continued to show a highly competitive race.
However, other research reached a more cautious conclusion. A study analyzing more than 2,500 political contracts across prediction market platforms found that forecasting accuracy varies significantly. PredictIt performed best, with 93% of its markets predicting outcomes better than chance, followed by Kalshi (78%) and Polymarket (67%).
The researchers also found price differences and arbitrage opportunities between platforms offering contracts on the same events, suggesting that not all prediction markets process information equally efficiently.
Prediction markets can also be highly accurate when forecasting economic events, especially those based on official data releases.
A 2026 Federal Reserve research paper compared Kalshi’s macroeconomic prediction markets with forecasts from professional surveys and traditional financial markets.
It found that Kalshi provided a reliable, continuously updated measure of market expectations. Its forecasts were particularly accurate for headline inflation and some Federal Reserve interest rate decisions, while for certain labor market indicators like unemployment, Kalshi performed about as well as traditional forecasts.
Research also shows that commercial market prices can provide useful forecasts, though not perfect ones. A 2026 study analyzing more than 300,000 Kalshi contract prices found that market prices generally became more accurate as contracts approached settlement.
The study also identified a favorite-longshot bias. Contracts with very low prices were less likely to be correct than their prices suggested, while higher-priced contracts tended to be more accurate. As a result, people who bought contracts priced below $0.10 lost more than 60% of their investment on average.
The bias was observed across multiple market categories, but the researchers found signs that it has been weakening over time.
No single metric fully represents prediction market accuracy. Instead, several metrics are used, each evaluating a different aspect of forecasting performance.
Directional accuracy measures how often the prediction market correctly identifies the winning outcome. If the contract that closes above $0.50 ends up being the actual result, the prediction is counted as correct.
This metric is simple to understand, but it doesn’t show how confident the market was in its prediction.
For example, a market that predicts every winner with only a 51% probability would still achieve 100% directional accuracy if all of those predictions were correct. It also treats a 51% prediction the same as a 99% prediction, even though one reflects much greater confidence than the other.
For this reason, directional accuracy should be used alongside other metrics that measure how well predicted probabilities match real-world outcomes.
Calibration measures how closely a prediction market’s probabilities match what actually happens. In other words, it looks at whether events priced at a given probability occur at roughly that rate.
For example, outcomes priced between 50% and 59% should happen about 50% to 59% of the time. If outcomes priced at 70% occur only 50% of the time, the market is overconfident because it overestimated their likelihood. If those same outcomes occur 85% of the time, the market is underconfident.
The Brier score measures how close predicted probabilities were to the actual outcome. Unlike directional accuracy, it rewards forecasts that are both correct and confident, while penalizing predictions that are wrong or poorly calibrated.
The Brier score is calculated using the following formula:

In the formula:
For example, suppose a market predicts an event has a 70% chance of happening:
A lower Brier score is better, with 0 representing a perfect forecast. For reference, always predicting a 50% probability for a yes/no event produces a Brier score of 0.25.
Log loss is another metric that measures how well predicted probabilities match the final outcome. As with the Brier score, a lower score indicates better predictions, but log loss imposes a much heavier penalty on high-confidence forecasts that turn out to be wrong.
For example, if a market gives an event a 99% probability but the event does not happen, it will receive a much worse log-loss score than if it had predicted the same event with only a 60% probability.
The Brier score and log loss are often used together. The Brier score provides an easy-to-understand measure of overall forecasting accuracy, while log loss highlights the most significant probability errors.
Prediction markets are generally more accurate when they can quickly reflect reliable information and a wide range of opinions. The following factors help prices stay closer to an event’s true probability.
Markets with higher liquidity are usually more accurate because traders can buy and sell without causing large price swings. This allows informed traders to act when they believe the odds don’t reflect the true likelihood of an outcome, helping move the market toward a more accurate price.
High trading volume alone is not enough, though. A market with diverse participants, tight spreads, and good depth is often more reliable than one with lots of activity but similar opinions.
Prediction markets become more accurate when traders use different information and reach their own conclusions. Some may analyze statistics, while others may follow news reports, expert analysis, or local information.
If everyone reacts to the same headlines or simply follows the market price, accuracy can suffer. Independent thinking helps the market reflect a broader range of information.
Prediction markets are easier to price accurately when everyone understands exactly what the contract means and how it will be settled. Clear rules allow traders to focus on predicting the outcome instead of interpreting the wording.
If the settlement rules are unclear, prices may reflect uncertainty about the contract itself rather than the event being predicted.
Prediction markets are more accurate when important information reaches traders quickly. Official announcements, verified news, and reliable data allow traders to react quickly, bringing market prices closer to the latest available information.
This matters most in sports markets, where injuries, starting lineups, goals, or referee decisions can change an outcome’s probability within seconds.
To get the most value from prediction markets, you need reliable data and a process for evaluating its accuracy. The following practices can help you build more accurate and trustworthy prediction market content.

Adding prediction markets to your sportsbook can require connecting to multiple exchanges, each with its own data formats, market structures, and pricing. A single, unified data feed removes that complexity.
LSports helps you launch, scale, and manage prediction markets through its Prediction Markets Feed. It aggregates real-time data from leading exchanges into one standardized feed, making it easier to integrate continuously updated market data into your platform.
Its coverage extends far beyond traditional sports, allowing you to offer prediction markets across categories such as:
LSports’ feed includes everything you need to power a complete prediction market offering, including:
Request a demo today to discover how LSports powers reliable prediction markets with accurate, real-time data.
No. Prediction markets often outperform polls because they continuously incorporate new information and financial incentives, but they are not always more accurate.
It depends on the event. Prediction markets can provide useful forecasts weeks or even months before an outcome, but accuracy generally improves as the event approaches and more information becomes available. This is why market prices often change significantly leading up to settlement.
Yes, but successful manipulation is often difficult and temporary in liquid markets. If someone pushes prices away from fair value, other traders have a financial incentive to trade against the mispricing, which can quickly move prices back toward their true value. Manipulation is more likely to have an effect in markets with low liquidity or few participants.
Political prediction markets can be highly accurate at forecasting election outcomes and may perform as well as or better than traditional polls. However, their accuracy can vary depending on factors such as liquidity, market design, and the number and diversity of participants.